I/O
There are some useful I/O classes for parsing/reading/writing formulas and other data structures.
Parsers
Parsers are used to parse formula strings into LogicNG formulas. Throughout the documentation, we use the pseudo-Boolean parser PseudoBooleanParser by calling p.parse(...), but - most important - we can also implement own parsers for our applications.
Parsers in LogicNG are generated by the parser framework ANTRL (LogicNG's only external dependency). You only define a grammar file and ANTLR generates the Java classes for the parser at compile time. LogicNG's parser grammars lie here. There are two parsers:
- PropositionalParser for parsing propositional formulas without cardinality or pseudo-Boolean constraints. Its grammar can be found here
- PseudoBooleanParser for parsing formulas with cardinality or pseudo-Boolean constraints.
Info
Since LogicNG 2.5.0 parsers for formula strings have been moved into an own project parser to avoid the ANTLR dependency which is unwanted for some applications.
Application Insight
You can easily implement you own parsers for you propositional language by looking at these grammar files and implementing your own parser inheriting from FormulaParser. Then you only need to write minimal code.
Readers
There are two formula readers implemented in LogicNG:
- DIMACS reader for reading CNF files as used in the SAT competition in the DIMACS CNF format.
- Formula reader for reading files in LogicNG syntax from a file.
The formula reader can read propositional formulas with or without pseudo-Boolean constraints. Multiple lines in a file are interpreted as a conjunction of the formulas in each line.
Writers
There are three writers for formulas in the org.logicng.io package:
- DIMACS writer for writing CNFs as DIMACS CNF files like described above.
- Formula writer for writing formulas in LogicNG syntax. The formula writer has the option
splitAndMultilinewhich, if set totrue, writes the different operands of a top-level conjunction in single lines. This can often improve readability, and the correspondingFormulaReadercan read this format.
For graphs, there are two writers:
- DIMACS writer for writing a DIMACS graph file of the graph.
Graphical Writers
Instead of writing plain text files of formulas, BDDs, or graphs, it is often desireable to generate graphical representations of these data structures. LogicNG has a generic framework for generating such graphical output in the package org.logicng.io.graphical. The framework has the following features:
- It can produce output in two different formats:
- DOT language: for generating files which can be turned into graphical representations by e.g. GraphViz
- Mermaid.js: With Mermaid.js you can easily integrate the generated graphs in a web page or application and can play around with it in the interactive live editor.
- Individual node labels: the node label can be dynamically generated depending on the node's content.
- Individual styling of nodes: The shape, stroke color, text color, and background color of nodes for the graph can be styled either by a fixed style or with a dynamically depending on their content.
- Individual styling of edges: The type and color of edges for the graph can be styled either by a fixed style or with a dynamically depending on the nodes they connect.
Basics
There are some basic classes which are used in all graphical representations:
GraphicalColorfor the representation of colors either in hex or in RGB whith some nice-looking predefined colors.GraphicalNodefor a node in the graphical representation.GraphicalEdgefor an edge in the graphical representation.GraphicalNodeStylefor the style of a node.GraphicalEdgeStylefor the style of an edge.
From these basic building blocks, a GraphicalRepresentation is built. This is always the first step and is usually done by using one of the implemented graphical generators (see next section). Once you have generated this representation, you can decide in which format and how it is written - either as string or directly to a file.
Graphical Generators
There are four different generators for graphs:
BddGraphicalGeneratorfor generating graphical output of BDDsFormulaAstGraphicalGeneratorfor generating graphical outputs of formula ASTsFormulaDagGraphicalGeneratorfor generating graphical outputs of formula DAGsGraphGraphicalGeneratorfor generating graphical outputs of graphs
Using the Default Styling
If you do not use any further styling, a sensible default look will be applied to the graph. As an example consider the AST (abstract syntax tree, c.f. here) of a formula. We consider the Formula A & B & (A | B) <=> C & (A | B) and create its default representation.
FormulaFactory f = new FormulaFactory();
Formula formula = f.parse("A & B & (A | B) <=> C & (A | B)");
FormulaAstGraphicalGenerator generator =
        FormulaAstGraphicalGenerator.builder().build();
GraphicalRepresentation representation = generator.translate(formula);
Since the generator was constructed with no individual styling in the builder, the default style is applied.
For DOT we write the output in a file, for Mermaid.js we just get the String of the representation.
This representation with Mermaid.js looks like this:
graph TD
  id0(["⇔"])
  id1(["∧"])
  id2(["A"])
  id3(["B"])
  id4(["∨"])
  id5(["A"])
  id6(["B"])
  id7(["∧"])
  id8(["C"])
  id9(["∨"])
  id10(["A"])
  id11(["B"])

  id1 --> id2
  id1 --> id3
  id4 --> id5
  id4 --> id6
  id1 --> id4
  id7 --> id8
  id9 --> id10
  id9 --> id11
  id7 --> id9
  id0 --> id1
  id0 --> id7
Customizing the Node Label
The generators can have their own mapping functions for the node label. Therefore the user has to implement the LabelMapper interface which only has one method which decides which label to use for each node. Alternatively you can just pass a lambda function as label mapper.
Consider an example where you want to write the whole sub-formula as the node label, then you could just use the toString() method as label mapper:
FormulaAstGraphicalGenerator generator = FormulaAstGraphicalGenerator.builder()
        .labelMapper(Formula::toString)
        .build();
Now the representation looks like this:
graph TD
  id0(["A & B & (A | B) <=> C & (A | B)"])
  id1(["A & B & (A | B)"])
  id2(["A"])
  id3(["B"])
  id4(["A | B"])
  id5(["A"])
  id6(["B"])
  id7(["C & (A | B)"])
  id8(["C"])
  id9(["A | B"])
  id10(["A"])
  id11(["B"])

  id1 --> id2
  id1 --> id3
  id4 --> id5
  id4 --> id6
  id1 --> id4
  id7 --> id8
  id9 --> id10
  id9 --> id11
  id7 --> id9
  id0 --> id1
  id0 --> id7
Styling Nodes and Edges with a Fixed Style
You can configure the generator with a default style for nodes in edges. If no dynamic style mapper is given, this style will be applied to all nodes and edges. The default style can be configured with the defaultEdgeStyle and defaultNodeStyle methods of the builder.
FormulaAstGraphicalGenerator generator = FormulaAstGraphicalGenerator.builder()
        .labelMapper(Formula::toString)
        .defaultEdgeStyle(GraphicalEdgeStyle.dotted(null)) // (1)!
        .defaultNodeStyle(GraphicalNodeStyle.rectangle(
            GraphicalColor.BLUE, GraphicalColor.WHITE, GraphicalColor.BLUE)) // (2)!
        .build();
- If you pass
nullas the color, the default value of the framework will be taken. In this case, Mermaid.js decides depending on light/dark mode how to color the edge. Try it: if you switch to dark mode, the edges are white, in light mode, they are black. - You can use some predefined color in the class
GraphicalColoror define your own in RGB or HEX.
This leads to the following graphics:
graph TD
  id0["A & B & (A | B) <=> C & (A | B)"]
    style id0 stroke:#004f93,color:#ffffff,fill:#004f93
  id1["A & B & (A | B)"]
    style id1 stroke:#004f93,color:#ffffff,fill:#004f93
  id2["A"]
    style id2 stroke:#004f93,color:#ffffff,fill:#004f93
  id3["B"]
    style id3 stroke:#004f93,color:#ffffff,fill:#004f93
  id4["A | B"]
    style id4 stroke:#004f93,color:#ffffff,fill:#004f93
  id5["A"]
    style id5 stroke:#004f93,color:#ffffff,fill:#004f93
  id6["B"]
    style id6 stroke:#004f93,color:#ffffff,fill:#004f93
  id7["C & (A | B)"]
    style id7 stroke:#004f93,color:#ffffff,fill:#004f93
  id8["C"]
    style id8 stroke:#004f93,color:#ffffff,fill:#004f93
  id9["A | B"]
    style id9 stroke:#004f93,color:#ffffff,fill:#004f93
  id10["A"]
    style id10 stroke:#004f93,color:#ffffff,fill:#004f93
  id11["B"]
    style id11 stroke:#004f93,color:#ffffff,fill:#004f93

  id1 --> id2
    linkStyle 0 stroke-width:2,stroke-dasharray:3
  id1 --> id3
    linkStyle 1 stroke-width:2,stroke-dasharray:3
  id4 --> id5
    linkStyle 2 stroke-width:2,stroke-dasharray:3
  id4 --> id6
    linkStyle 3 stroke-width:2,stroke-dasharray:3
  id1 --> id4
    linkStyle 4 stroke-width:2,stroke-dasharray:3
  id7 --> id8
    linkStyle 5 stroke-width:2,stroke-dasharray:3
  id9 --> id10
    linkStyle 6 stroke-width:2,stroke-dasharray:3
  id9 --> id11
    linkStyle 7 stroke-width:2,stroke-dasharray:3
  id7 --> id9
    linkStyle 8 stroke-width:2,stroke-dasharray:3
  id0 --> id1
    linkStyle 9 stroke-width:2,stroke-dasharray:3
  id0 --> id7
    linkStyle 10 stroke-width:2,stroke-dasharray:3
Styling Nodes and Edges Dynamically
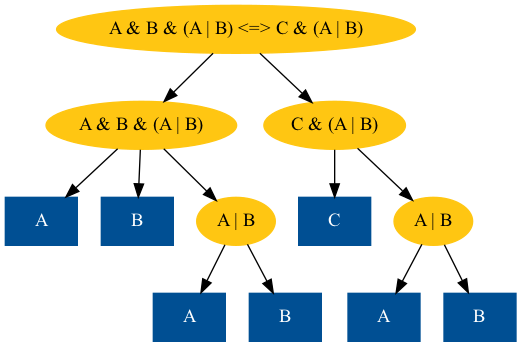
You can also style nodes and edges dynamically by passing node style or edge style mappers to the builder. In the following example we want to distinguish between nodes with literals (terminals) and nodes with sub-formulas (inner nodes). This can be done by configuring the generator with its own NodeStyleMapper. As above: you can either implement a sub-class or just pass a lambda function.
GraphicalNodeStyle terminalNodeStyle =
        GraphicalNodeStyle.rectangle(BLUE, WHITE, BLUE);
GraphicalNodeStyle innerNodeStyle =
        GraphicalNodeStyle.ellipse(YELLOW, BLACK, YELLOW);

FormulaAstGraphicalGenerator generator = FormulaAstGraphicalGenerator.builder()
        .labelMapper(Formula::toString)
        .nodeStyleMapper((phi) ->
            phi.type() == FType.LITERAL ? terminalNodeStyle : innerNodeStyle)
        .build();
This leades exactly to the representation of our documentation:
graph TD
  id0(["A & B & (A | B) <=> C & (A | B)"])
    style id0 stroke:#ffc612,color:#000000,fill:#ffc612
  id1(["A & B & (A | B)"])
    style id1 stroke:#ffc612,color:#000000,fill:#ffc612
  id2["A"]
    style id2 stroke:#004f93,color:#ffffff,fill:#004f93
  id3["B"]
    style id3 stroke:#004f93,color:#ffffff,fill:#004f93
  id4(["A | B"])
    style id4 stroke:#ffc612,color:#000000,fill:#ffc612
  id5["A"]
    style id5 stroke:#004f93,color:#ffffff,fill:#004f93
  id6["B"]
    style id6 stroke:#004f93,color:#ffffff,fill:#004f93
  id7(["C & (A | B)"])
    style id7 stroke:#ffc612,color:#000000,fill:#ffc612
  id8["C"]
    style id8 stroke:#004f93,color:#ffffff,fill:#004f93
  id9(["A | B"])
    style id9 stroke:#ffc612,color:#000000,fill:#ffc612
  id10["A"]
    style id10 stroke:#004f93,color:#ffffff,fill:#004f93
  id11["B"]
    style id11 stroke:#004f93,color:#ffffff,fill:#004f93

  id1 --> id2
  id1 --> id3
  id4 --> id5
  id4 --> id6
  id1 --> id4
  id7 --> id8
  id9 --> id10
  id9 --> id11
  id7 --> id9
  id0 --> id1
  id0 --> id7
And here the corresponding dot file output: