Feature Preview LogicNG 2.4.0: Graphics Generators
LogicNG 2.4.0 introduces a completely rewritten graphics generation for DAGs and ASTs of formulas, BDDs, and graphs. There are two major new features:
- There is a new output format besides the DOT language: The markdown-like syntax of Mermaid.js. With Mermaid.js you can easily integrate the generated graphs in a web page or application and can play around with it in the interactive live editor.
- You can now style all nodes and edges when generating a graph. So you can now decide, what content should be in the node label, what stroke, text, and background color the nodes should have, and how the edges should be styled. This can be done by a fixed style or by dynamically styling the nodes and edges depending on their content.
A Simple Example
To demonstrate these new features, let's look at the AST (abstract syntax tree, c.f. here) of a formula from our documentation. We consider the Formula A & B & (A | B) <=> C & (A | B) and create its default representation.
FormulaFactory f = new FormulaFactory();
Formula formula = f.parse("A & B & (A | B) <=> C & (A | B)");
FormulaAstGraphicalGenerator generator =
        FormulaAstGraphicalGenerator.builder().build();
GraphicalRepresentation representation = generator.translate(formula);
For DOT we write the output in a file, for Mermaid.js we just get the String of the representation.
This representation with Mermaid.js looks like this:
graph TD
  id0(["⇔"])
  id1(["∧"])
  id2(["A"])
  id3(["B"])
  id4(["∨"])
  id5(["A"])
  id6(["B"])
  id7(["∧"])
  id8(["C"])
  id9(["∨"])
  id10(["A"])
  id11(["B"])

  id1 --> id2
  id1 --> id3
  id4 --> id5
  id4 --> id6
  id1 --> id4
  id7 --> id8
  id9 --> id10
  id9 --> id11
  id7 --> id9
  id0 --> id1
  id0 --> id7
Note how this graph automatically changes its colors depending on the light/dark theme of this page.
Customizing the Node Label
Perhaps you don't want the default node labels with just the UTF-8 characters "∧", "∨", or "⇔" for the operators. Then you can configure the generator with your own LabelMapper which decides how to fill the label of a node. In this case, perhaps you want to write the whole subformula in each label. You can either implement your own sub-class of LabelMapper or just use a lambda function in the builder of the generator:
FormulaAstGraphicalGenerator generator = FormulaAstGraphicalGenerator.builder()
        .labelMapper(Formula::toString)
        .build();
Now the representation looks like this:
graph TD
  id0(["A & B & (A | B) <=> C & (A | B)"])
  id1(["A & B & (A | B)"])
  id2(["A"])
  id3(["B"])
  id4(["A | B"])
  id5(["A"])
  id6(["B"])
  id7(["C & (A | B)"])
  id8(["C"])
  id9(["A | B"])
  id10(["A"])
  id11(["B"])

  id1 --> id2
  id1 --> id3
  id4 --> id5
  id4 --> id6
  id1 --> id4
  id7 --> id8
  id9 --> id10
  id9 --> id11
  id7 --> id9
  id0 --> id1
  id0 --> id7
Of course you could use your own FormulaStringRepresentation for the string formatter of the formula.
Styling Nodes and Edges with a Fixed Style
You can configure the generator with a default style for nodes in edges. If no dynamic style mapper is given, this style will be applied to all nodes and edges. Let us style our representation with dotted edges and blue rectangles for the nodes.
FormulaAstGraphicalGenerator generator = FormulaAstGraphicalGenerator.builder()
        .labelMapper(Formula::toString)
        .defaultEdgeStyle(GraphicalEdgeStyle.dotted(null)) // (1)!
        .defaultNodeStyle(GraphicalNodeStyle.rectangle(
            GraphicalColor.BLUE, GraphicalColor.WHITE, GraphicalColor.BLUE)) // (2)!
        .build();
- If you pass
nullas the color, the default value of the framework will be taken. In this case, Mermaid.js decides depending on light/dark mode how to color the edge. Try it: if you switch to dark mode, the edges are white, in light mode, they are black. - You can use some predefined color in the class
GraphicalColoror define your own in RGB or HEX.
This leads to the following graphics:
graph TD
  id0["A & B & (A | B) <=> C & (A | B)"]
    style id0 stroke:#004f93,color:#ffffff,fill:#004f93
  id1["A & B & (A | B)"]
    style id1 stroke:#004f93,color:#ffffff,fill:#004f93
  id2["A"]
    style id2 stroke:#004f93,color:#ffffff,fill:#004f93
  id3["B"]
    style id3 stroke:#004f93,color:#ffffff,fill:#004f93
  id4["A | B"]
    style id4 stroke:#004f93,color:#ffffff,fill:#004f93
  id5["A"]
    style id5 stroke:#004f93,color:#ffffff,fill:#004f93
  id6["B"]
    style id6 stroke:#004f93,color:#ffffff,fill:#004f93
  id7["C & (A | B)"]
    style id7 stroke:#004f93,color:#ffffff,fill:#004f93
  id8["C"]
    style id8 stroke:#004f93,color:#ffffff,fill:#004f93
  id9["A | B"]
    style id9 stroke:#004f93,color:#ffffff,fill:#004f93
  id10["A"]
    style id10 stroke:#004f93,color:#ffffff,fill:#004f93
  id11["B"]
    style id11 stroke:#004f93,color:#ffffff,fill:#004f93

  id1 --> id2
    linkStyle 0 stroke-width:2,stroke-dasharray:3
  id1 --> id3
    linkStyle 1 stroke-width:2,stroke-dasharray:3
  id4 --> id5
    linkStyle 2 stroke-width:2,stroke-dasharray:3
  id4 --> id6
    linkStyle 3 stroke-width:2,stroke-dasharray:3
  id1 --> id4
    linkStyle 4 stroke-width:2,stroke-dasharray:3
  id7 --> id8
    linkStyle 5 stroke-width:2,stroke-dasharray:3
  id9 --> id10
    linkStyle 6 stroke-width:2,stroke-dasharray:3
  id9 --> id11
    linkStyle 7 stroke-width:2,stroke-dasharray:3
  id7 --> id9
    linkStyle 8 stroke-width:2,stroke-dasharray:3
  id0 --> id1
    linkStyle 9 stroke-width:2,stroke-dasharray:3
  id0 --> id7
    linkStyle 10 stroke-width:2,stroke-dasharray:3
Styling Nodes and Edges Dynamically
Now we want to change the look of the nodes dynamically by their content. In this case we want to distinguish between nodes with literals (terminals) and nodes with sub-formulas (inner nodes) - but you could look at arbitrary properties of the node content. To do this, you have to configure the generator with its own NodeStyleMapper. As above: you can either implement a sub-class or just pass a lambda function.
GraphicalNodeStyle terminalNodeStyle =
        GraphicalNodeStyle.rectangle(BLUE, WHITE, BLUE);
GraphicalNodeStyle innerNodeStyle =
        GraphicalNodeStyle.ellipse(YELLOW, BLACK, YELLOW);

FormulaAstGraphicalGenerator generator = FormulaAstGraphicalGenerator.builder()
        .labelMapper(Formula::toString)
        .nodeStyleMapper((phi) ->
            phi.type() == FType.LITERAL ? terminalNodeStyle : innerNodeStyle)
        .build();
This leades exactly to the representation of our documentation:
graph TD
  id0(["A & B & (A | B) <=> C & (A | B)"])
    style id0 stroke:#ffc612,color:#000000,fill:#ffc612
  id1(["A & B & (A | B)"])
    style id1 stroke:#ffc612,color:#000000,fill:#ffc612
  id2["A"]
    style id2 stroke:#004f93,color:#ffffff,fill:#004f93
  id3["B"]
    style id3 stroke:#004f93,color:#ffffff,fill:#004f93
  id4(["A | B"])
    style id4 stroke:#ffc612,color:#000000,fill:#ffc612
  id5["A"]
    style id5 stroke:#004f93,color:#ffffff,fill:#004f93
  id6["B"]
    style id6 stroke:#004f93,color:#ffffff,fill:#004f93
  id7(["C & (A | B)"])
    style id7 stroke:#ffc612,color:#000000,fill:#ffc612
  id8["C"]
    style id8 stroke:#004f93,color:#ffffff,fill:#004f93
  id9(["A | B"])
    style id9 stroke:#ffc612,color:#000000,fill:#ffc612
  id10["A"]
    style id10 stroke:#004f93,color:#ffffff,fill:#004f93
  id11["B"]
    style id11 stroke:#004f93,color:#ffffff,fill:#004f93

  id1 --> id2
  id1 --> id3
  id4 --> id5
  id4 --> id6
  id1 --> id4
  id7 --> id8
  id9 --> id10
  id9 --> id11
  id7 --> id9
  id0 --> id1
  id0 --> id7
And here the corresponding dot file output:
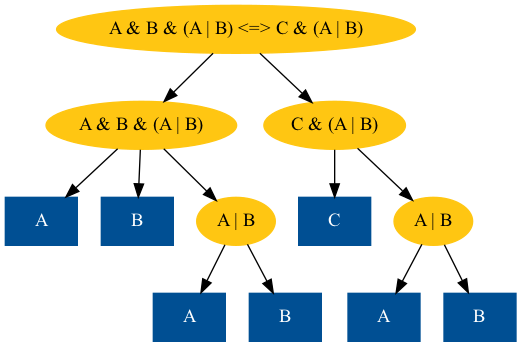
Since this is a statically generated PNG graphics, of course there is no dynamic color switching for light/dark mode like with the Mermaid.js output.